DeFi / 9 min read
APR vs APY in crypto: calculate compounding and real costs
Compare APR and APY with compounding examples. Separate token rewards from cash returns and account for fees, variable rates and withdrawal conditions.
Educational guide · Sources checked before publication
A percentage needs a definition before comparison
Crypto applications often display APR or APY beside staking, lending or liquidity products. APR generally expresses an annualized rate without compounding, while APY expresses an annualized result that includes a specified compounding assumption. Interfaces can use these labels inconsistently, so the definition and calculation method matter more than the acronym alone.
Neither number guarantees what you will earn. A displayed rate may extrapolate recent activity, change with utilization or include rewards paid in another token. The underlying position can also lose market value. A larger number is therefore not automatically a better offer, and it cannot be evaluated independently of custody, withdrawal conditions and the source of payments.
This guide explains the arithmetic with fictional figures and a comparison worksheet. It does not rank providers or quote current yields. Staking mechanics and lending liquidations have their own Academy guides. Here the question is narrower: what does the advertised percentage measure, and how can you translate it into a transparent scenario?
Simple annualization and compounding
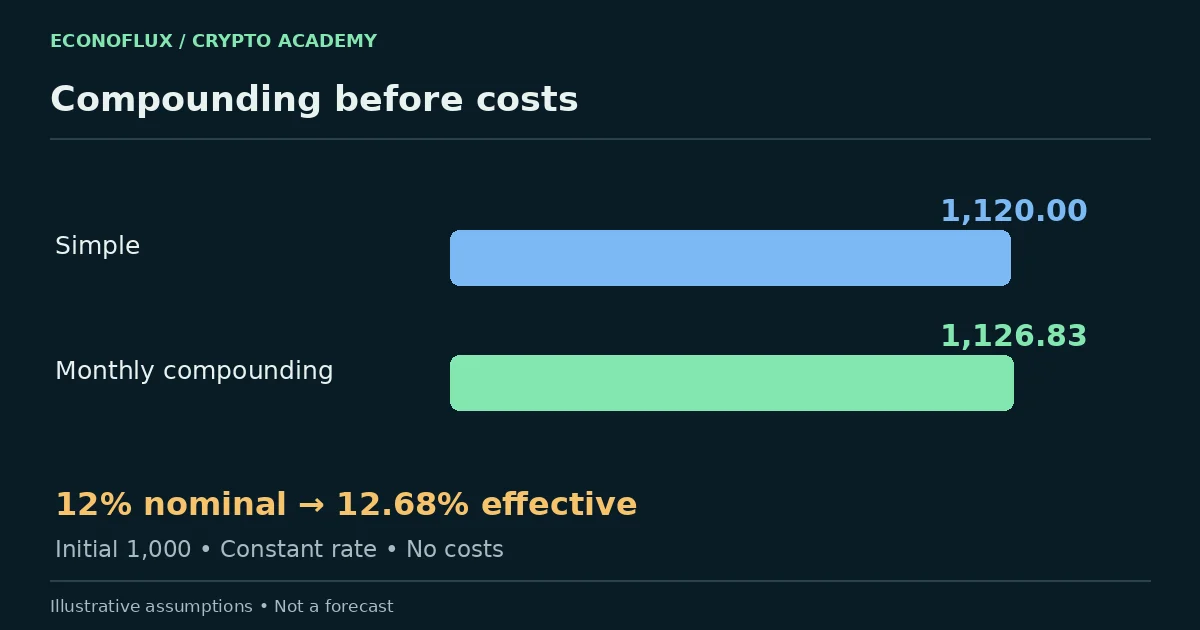
Suppose a balance of 1,000 units earns a fixed 12% annual rate without reinvesting rewards. Under a simple one-year model, the reward is 120 and the ending amount is 1,120. If the annual rate were applied proportionally for half a year, the simple reward would be 60. Real products can use different day-count and accrual conventions.
Compounding means adding earnings to the balance that earns subsequent rewards. If the same nominal 12% rate is divided into twelve monthly periods, each period earns 1% on the then-current balance. After one month the balance is 1,010; after two it is 1,020.10. The extra ten cents in the second month reflects earnings on the previous reward.
After twelve periods, the balance is 1,000 times 1.01 raised to twelve, approximately 1,126.83. The effective annual yield is about 12.68%, before costs. This result assumes a constant rate, complete reinvestment, no delays and no losses. It is a mathematical scenario, not a property that every crypto product automatically delivers.
The conversion formula and its limits
Keep rate, frequency and period consistent For a nominal annual rate r compounded n times per year, the effective annual yield is (1 + r/n) raised to n, minus one. Enter rates as decimals: 12% becomes 0.12. With n equal to twelve, the result is approximately 0.126825, or 12.68%. Using twelve as the rate instead of 0.12 produces meaningless output.
More frequent compounding increases the modeled yield when the rate is positive and other assumptions remain unchanged. The difference can be modest at ordinary rates and much larger at extreme ones. That mathematical increase does not account for gas, swap costs, waiting periods or the possibility that rewards cannot be reinvested in the same product.
If the displayed APY already includes compounding, do not apply the compounding formula again. Doing so double-counts the effect. Ask whether the product reports a nominal rate, an effective rate or a backward-looking realized return. Comparing these without conversion can make identical economics appear different.
Annualized does not mean earned over a full year
A dashboard may observe a short period and project it over twelve months. If a position earns 1% in one month, simple annualization suggests 12%; repeating and compounding that monthly result gives about 12.68%. Both calculations assume the short period is representative, which may be especially doubtful during unusually high trading activity or temporary incentives.
A seven-day reward spike can produce a striking annualized figure even if the program ends soon. Check the observation window, remaining incentive duration and whether the rate uses current prices for reward tokens. A number can be mathematically correct under its method while remaining a poor prediction of the next year.
For a position held less than a year, estimate the actual holding-period result rather than treating the annual figure as an entitlement. Under a constant effective APY A, a fractional-year model gives growth of (1 + A) raised to the year fraction, minus one. Actual withdrawal and accrual rules can make even that approximation unsuitable.
Token yield and cash return are different
Suppose you deposit 100 units of token X at a price of 10, for an initial value of 1,000. After a year you hold 110 units, a 10% increase in token quantity. If the price is then 6, the position is worth 660 before costs. Despite positive token yield, the cash-value loss is 34%.
If rewards are paid in a different token Y, their value depends on Y's price and your ability to exchange it. A dashboard may mark rewards at a quoted price that is difficult to realize for the full amount. Vesting or claim restrictions can further separate a displayed reward from money you can actually use.
Record both units and valuation currency. A statement such as earned 10% is incomplete without saying 10% of what, over which period and measured in which asset. This distinction is especially important when comparing a volatile-token reward with a product whose accounting unit tracks a national currency.
Separate organic income from incentive emissions
Payments can originate from borrower interest, trading fees, protocol issuance, promotional subsidies or a combination. Each source has different economic dependencies. Borrower demand can change, trading volume can fall and an incentive allocation can run out. A high displayed rate does not identify which source is sustainable.
If a product advertises a base rate plus a reward rate, inspect both components separately. Check whether they use the same denominator and whether the reward is paid in the deposited asset. Adding percentages can obscure token-price assumptions or overlapping calculations. A breakdown is more useful than one large headline number.
Protocol issuance also changes supply. Receiving more units does not by itself show that your purchasing power increased relative to the broader market. This is not an argument that every emission-funded reward is worthless; it is a reminder that quantity growth and economic return answer different questions.
Costs can outweigh the benefit of frequent compounding
In the 1,000-unit, 12% nominal-rate example, monthly compounding adds about 6.83 beyond the 120 simple annual reward. If each of twelve reinvestments costs one unit, transaction expenses alone total twelve. The extra compounding gain does not cover that simplified cost. The actual net result also depends on when the fees are paid and whether they reduce the earning balance.
Automatic compounding may reduce manual work, but a vault can charge management or performance fees and introduce additional contracts. It may convert rewards through swaps, incurring spread or price impact. Check whether the advertised APY is before or after these costs and whether it assumes a deposit size much larger than yours.
For small balances, fixed network charges can dominate. Calculate the incremental reward expected before the next reinvestment and compare it with all execution costs. A more frequent schedule is not automatically economically superior. No compounding frequency can compensate for a fundamentally unsuitable or unsafe underlying position.
Withdrawal rules belong in the return calculation
A displayed rate may apply while funds are locked, queued or otherwise unavailable for immediate withdrawal. Determine when rewards start, when they stop and whether exiting incurs charges. If you need funds sooner than the stated process allows, the advertised annual return does not solve the liquidity mismatch.
Selling a receipt or liquid-staking token can be an alternative to protocol withdrawal, but the market price can differ from its reference value. That route introduces market depth and execution costs. Do not assume the ability to trade a representation guarantees immediate redemption at a fixed price.
Also inspect whether a provider can suspend withdrawals or alter terms. Custodial risk, smart-contract risk and market risk are not encoded in APR or APY. Two products with the same percentage can have very different conditions and failure modes. The comparison must include how principal and rewards can actually be recovered.
A practical comparison worksheet
For each product, record the rate label, calculation method, observation period, reward asset, compounding frequency and whether reinvestment is automatic. Separate base income from incentives. List platform, transaction, management and withdrawal costs, along with minimum amounts and any lock or queue.
Build a simple quantity scenario first. Then value the final assets under several price assumptions, including a decline. Show the result if the rate falls halfway through the period or incentives end. Do not continue using a constant-rate formula after deliberately changing the rate; calculate each interval separately with its own assumptions.
Finally, compare the outcome with the same starting assets held without the product. This helps distinguish rewards for additional risk from gains caused simply by market appreciation. For liquidity provision, include the holding benchmark and divergence described in the impermanent-loss guide. A return figure is only meaningful when its alternative is clear.
Red flags in yield marketing
Be cautious when an offer advertises a high fixed return but does not explain who pays it, how the rate is calculated or how principal can be withdrawn. A calculator projecting an exponential balance is not evidence that the income source exists. Referral rewards and promotional screenshots do not replace audited financial or protocol information.
Watch for comparisons that mix gross APY with net APR, short-term annualized rewards with long-term realized results, or stable accounting units with volatile reward tokens. These can be misleading even without an arithmetic error. Ask for the inputs and reproduce the calculation using the actual amount and duration you are considering.
No legitimate explanation of APR requires your private key or recovery phrase. You can inspect definitions and perform every calculation in this guide without connecting a wallet. If the necessary information is unavailable, the uncertainty itself belongs in the comparison rather than being replaced with the advertised headline.
Frequently asked questions
Is APY always higher than APR? Under the same positive nominal rate and reinvestment assumptions, compounding raises the effective annual result. Different products may use different inputs, so their displayed numbers are not directly comparable.
Does a 20% APY guarantee 20% more money? No. It depends on the rate, reinvestment, costs, asset prices and product performance. The percentage may describe token quantities rather than cash return.
Should I compound every day? Not automatically. Compare the additional reward with execution costs and operational requirements. Frequent compounding can reduce net results for small balances.
Can I divide APY by twelve for a monthly return? That is not the exact effective monthly conversion. Under constant compounding assumptions, use (1 + APY) raised to one-twelfth, minus one. Actual products may accrue differently.
Are lending, staking and liquidity APRs interchangeable? No. They can originate from different activities, use different assets and expose you to different risks. Normalize the arithmetic, then evaluate the underlying mechanism separately.
Sources & further reading
Sources and methodology · Report a correction
For information only. Not financial advice.