markets / 6 min read / Analysis
BTC, ETH and SOL market report: 2026-11-06, edition 1
Bitcoin, Ethereum and Solana are being assessed against a volatile backdrop: reports published on November 6 describe technology-stock losses and crypto ETF withdrawals in the preceding session. Those observations help explain the risk environment, but do not establish a single cause for the latest price snapshot.
Provider price data checked against the archived snapshot. Context and possible drivers are attributed to the linked reporting; timing or correlation alone does not prove causation.
What is established
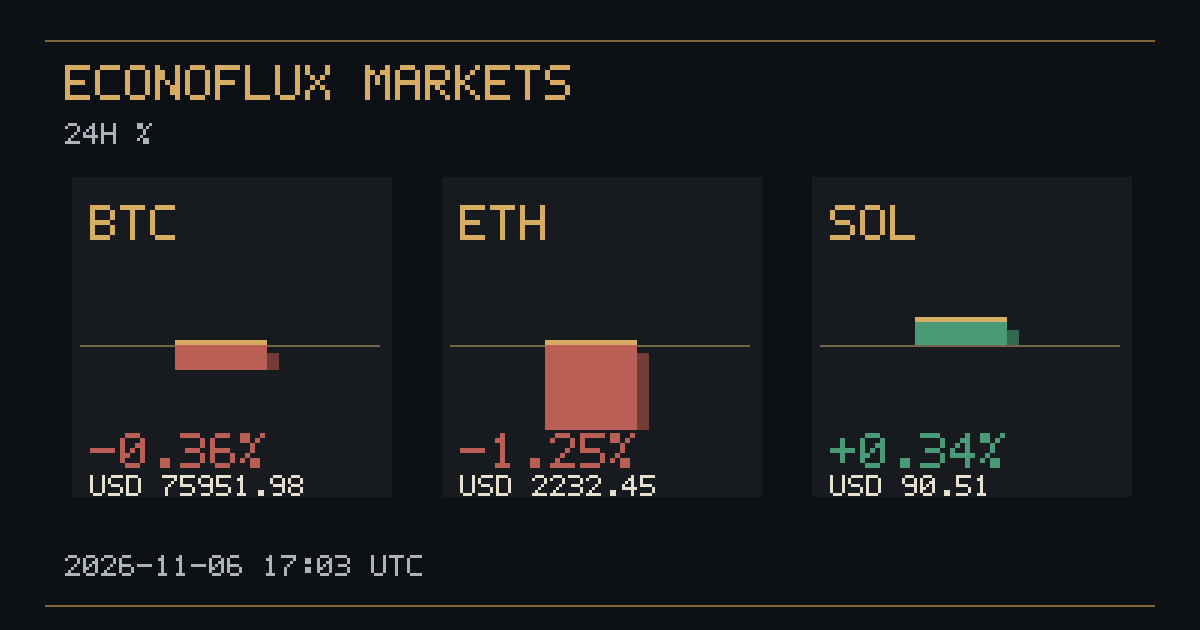
- BTC: USD 75951.98; -0.36%
- ETH: USD 2232.45; -1.25%
- SOL: USD 90.51; +0.34%
The market snapshot
Of the three assets covered here, 1 show a positive daily change and 2 show a negative change; any remaining asset is unchanged. The scope is limited to Bitcoin, Ethereum and Solana. This sample does not establish the direction of all crypto assets, and the results should not be treated as a market-wide index.
| Asset | Price (USD) | Rolling daily change | Provider timestamp (UTC) |
|---|---|---|---|
| BTC | 75951.98 | -0.36% | 2026-11-06T17:03:58.000Z |
| ETH | 2232.45 | -1.25% | 2026-11-06T17:03:58.000Z |
| SOL | 90.51 | +0.34% | 2026-11-06T17:03:58.000Z |
Two different clocks: current quotes and the preceding session
The table in this edition records the provider’s timestamp and rolling daily change for each asset. The contextual reports below were published on November 6, 2026, and describe the November 5 session. These are different measurement periods: a previous trading session’s flows cannot be presented as final flows for November 6.
This distinction matters when reading an intraday recovery or decline. A rolling daily percentage compares prices across its own reference window, while an ETF flow report describes a dated session. Neither series by itself identifies the trade or headline responsible for the latest move.
ETF redemptions: evidence of withdrawals, not a complete explanation
Cointribune reports that US spot Bitcoin ETFs recorded $430.23 million in net outflows on November 5, while Ether funds lost $99.98 million. The outlet says no Bitcoin ETF in its reported group recorded a positive inflow that session. These are reported fund-flow figures, not measurements of every investor’s spot-market activity.
Cointribune also explains the limitation: daily flows measure net share creations and redemptions without revealing every underlying strategy. Its interpretation is that portfolio managers reducing risk can cut technology equities and crypto exposure together. That is an attributed explanation of a possible transmission mechanism; the flow totals do not establish that ETF withdrawals alone caused the price move.
Technology shares and volatility formed the broader backdrop
BeInCrypto’s November 6 analysis reports that the Nasdaq Composite fell 5.52% on November 5, the S&P 500 lost 4.36%, and the Philadelphia Semiconductor Index dropped 12.25%. It also reports a VIX close of 28.18. These figures refer to the earlier equity session and its volatility reading, rather than current crypto quotes.
The simultaneous weakness helps frame the reports’ description of a broader reduction in appetite for risk. It does not demonstrate that a stock-index move mechanically determines Bitcoin’s price, or that every crypto holder acted for the same reason. A causal claim about a particular token would require evidence beyond coinciding declines.
Why Bitcoin, Ether and Solana need separate readings
Crypto Economy reports approximately $1.2 million in net outflows from Solana ETF products on November 5. That is another dated observation, not a comprehensive account of Solana trading. Its report also describes withdrawals from Bitcoin and Ether products; this is overlapping coverage of fund-flow data, not independent proof of a separate catalyst.
The linked reporting does not isolate why the current rolling daily percentage differs across BTC, ETH and SOL. Different performance should therefore be described from the archived quote table, without inventing token-specific buying, network activity, liquidations or announcements to explain the gap.
What would strengthen or change the explanation
New session-specific ETF figures, identifiable announcements and documented trading or positioning data could add evidence. The November 5 flows remain historical context until newer figures are available; this edition does not supply a final November 6 flow total or claim that an observed bounce proves sustained demand.
The practical reading is to keep three layers separate: dated observations reported by the linked outlets, their interpretation of risk reduction, and causes that remain unproven. This report explains those limits alongside the price snapshot and offers general market information, not a personalised investment recommendation.
Bitcoin (BTC)
Bitcoin (BTC) is quoted at USD 75951.98, with a daily change of -0.36% over the provider’s comparison window (a decline). The daily percentage describes movement relative to that window’s reference price; it is not a forecast, a guarantee of an executable price, or a return an individual reader has earned.
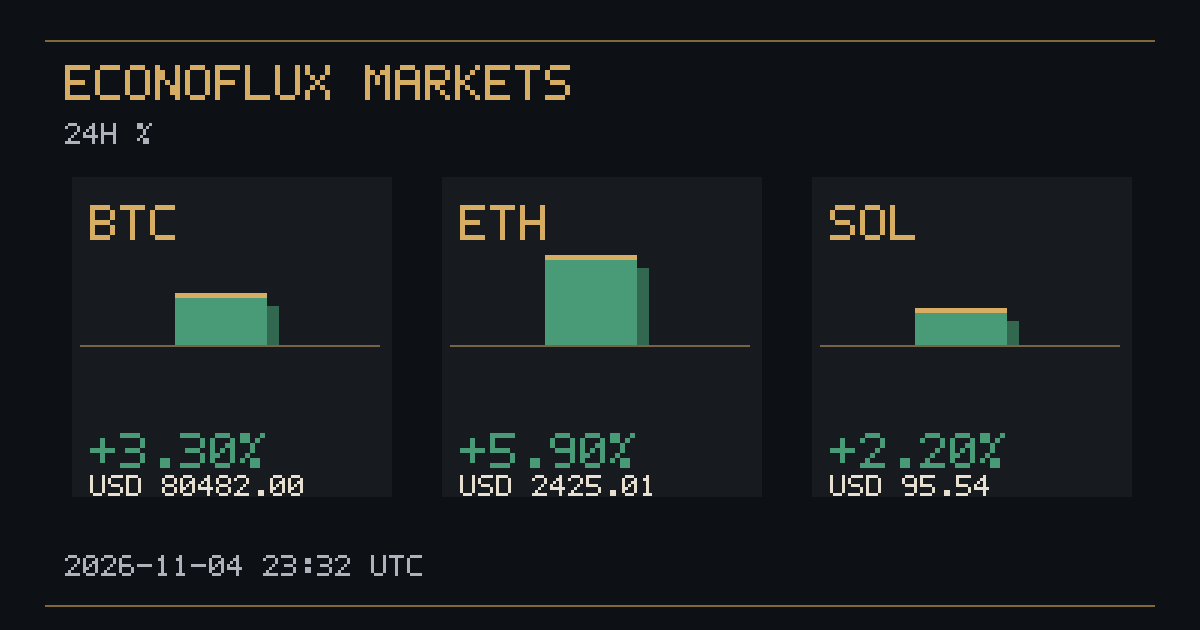
Compared with EconoFlux’s preceding market edition, which recorded USD 80482.00, the price in this snapshot changes by -5.63%. This separate calculation compares the two archived snapshots; it is not the provider’s daily percentage.
Ethereum (ETH)
Ethereum (ETH) is quoted at USD 2232.45, with a daily change of -1.25% over the provider’s comparison window (a decline). The daily percentage describes movement relative to that window’s reference price; it is not a forecast, a guarantee of an executable price, or a return an individual reader has earned.
Compared with EconoFlux’s preceding market edition, which recorded USD 2425.01, the price in this snapshot changes by -7.94%. This separate calculation compares the two archived snapshots; it is not the provider’s daily percentage.
Solana (SOL)
Solana (SOL) is quoted at USD 90.51, with a daily change of +0.34% over the provider’s comparison window (a gain). The daily percentage describes movement relative to that window’s reference price; it is not a forecast, a guarantee of an executable price, or a return an individual reader has earned.
Compared with EconoFlux’s preceding market edition, which recorded USD 95.54, the price in this snapshot changes by -5.26%. This separate calculation compares the two archived snapshots; it is not the provider’s daily percentage.
Relative performance within the sample
SOL has the highest daily percentage reading and ETH the lowest. The gap between those readings is 1.60 percentage points. This ranking compares percentages, not asset price levels, trading volume, market capitalization or investment quality. A higher quoted unit price does not by itself imply a larger network or better performance.
Source, timing and limits
This edition preserves the CryptoNews API price snapshot at 2026-11-06 17:03 UTC. The image is an original visualization of these daily percentage changes, not a historical price chart or a photograph. Quotes may have up to 15 minutes of provider delay and can change after publication. Later editions use new snapshots; this report keeps its original figures and timestamp.
Price data alone do not establish a cause for a move. This edition does not infer ETF flows, liquidations, trading volume, institutional activity or macroeconomic causes from the quotes. Such claims require separate identifiable evidence. This is general market information and does not offer personalized investment advice.
Sources & further reading
For information only. Not financial advice.