markets / 6 min read / Analysis
BTC, ETH and SOL market report: 2026-11-04, edition 1
This market edition examines the reported political backdrop to the rebound, an analyst’s interpretation of regulatory uncertainty, and the previous session’s ETF withdrawals. Those sources help explain the debate around Bitcoin, Ethereum and Solana; they do not establish a single proven cause for every price move.
Provider price data checked against the archived snapshot. Context and possible drivers are attributed to the linked reporting; timing or correlation alone does not prove causation.
What is established
- BTC: USD 80482.00; +3.30%
- ETH: USD 2425.01; +5.90%
- SOL: USD 95.54; +2.20%
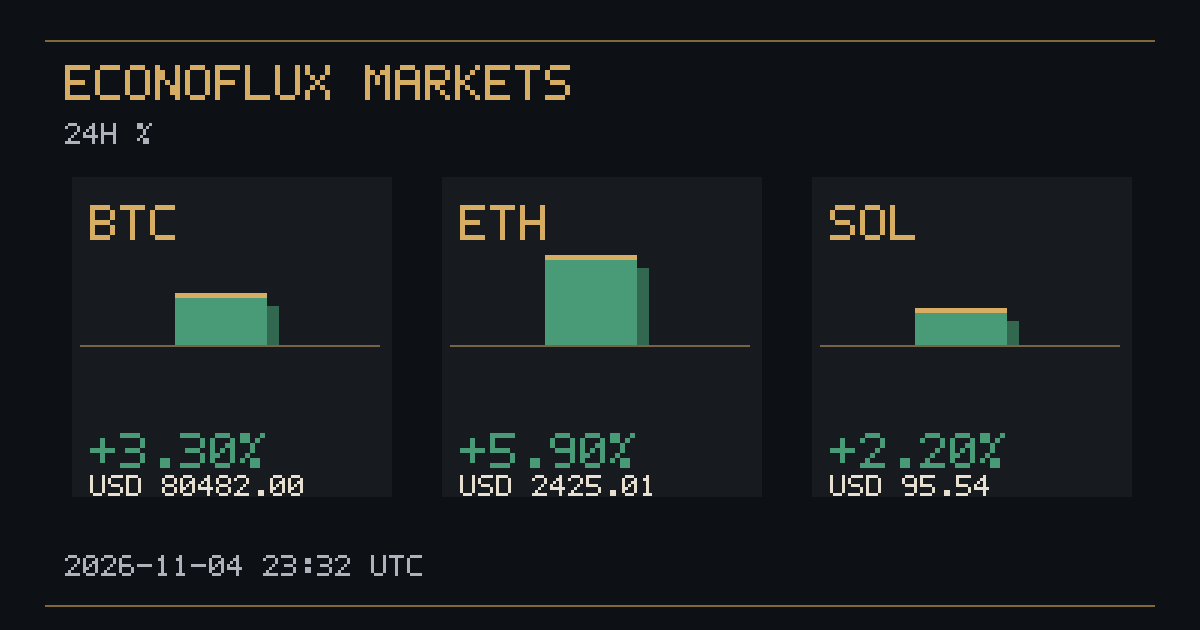
The market snapshot
Of the three assets covered here, 3 show a positive daily change and 0 show a negative change; any remaining asset is unchanged. The scope is limited to Bitcoin, Ethereum and Solana. This sample does not establish the direction of all crypto assets, and the results should not be treated as a market-wide index.
| Asset | Price (USD) | Rolling daily change | Provider timestamp (UTC) |
|---|---|---|---|
| BTC | 80482.00 | +3.30% | 2026-11-04T23:32:54.000Z |
| ETH | 2425.01 | +5.90% | 2026-11-04T23:32:54.000Z |
| SOL | 95.54 | +2.20% | 2026-11-04T23:32:54.000Z |
What was happening around the rebound?
CryptoBriefing’s report published on 4 November described Bitcoin recovering from a brief dip below USD 76000 to above USD 78000 during coverage of the US midterm results. That is a report about the earlier sequence of trading, not the price of this edition’s later snapshot. The figures in the table come from CryptoNews API at the separately stated time; the two sources should not be presented as one continuous trade-by-trade record.
The political developments therefore provide a documented backdrop to the recovery. Their timing does not prove that the election outcome was its sole cause. Price movements can reflect several influences, and this report does not have the transaction-level evidence needed to assign a precise contribution to each one.
The policy channel: an attributed explanation, not a certainty
CryptoBriefing attributed a more nuanced interpretation to Lacie Zhang, research lead at Bitget Wallet. In that account, a Congress with stronger Democratic representation could slow market-structure legislation such as the CLARITY Act and increase scrutiny of the industry. At the same time, divided government could make abrupt policy changes less likely. These are possible effects on expectations, not an announcement that a particular law has passed or that regulation has become uniformly more favorable.
Zhang’s interpretation was that near-term Bitcoin trading could depend more on macroeconomic conditions and onchain demand than on the election result itself. That distinction matters: the source offers an analyst’s framework for reading the move, rather than proof of a new rate decision, a measured surge in onchain purchases or a guaranteed political explanation. No specific interest-rate change or macroeconomic release is asserted here without data.
The ETF figures do not support a simple institutional-inflow story
BeInCrypto reported, citing SoSoValue, net withdrawals of USD 115.56 million from US Bitcoin spot ETFs and USD 85.35 million from Ethereum funds for the session of 3 November. The article was published on 4 November. Those are attributed figures for the preceding session, not verified final fund flows for the later snapshot in this market edition.
It would therefore be misleading to cite that report as evidence that fresh Bitcoin and Ethereum ETF inflows caused the rise. The source describes outflows in a different reporting window. ETF flows also cover a particular investment channel rather than every transaction in the underlying crypto market. The available figures do not establish the net balance of all buying and selling across exchanges or the reason each asset moved.
Campaign spending is background, not spot buying pressure
Reuters reported on 27 October, in coverage reproduced by Investing.com, that crypto interests had spent roughly USD 176 million across more than 100 midterm races. The report described a longer-term effort to build political relationships and support legislation. Its publication predates the election and the price snapshot used here.
That money should not be described as a fresh injection into Bitcoin or Ethereum. Campaign-finance spending is different from orders to purchase crypto assets. The reporting helps explain why the industry was watching the election closely; it does not measure buying pressure in the market or prove that political spending generated the rebound.
What explains the differences between Bitcoin, Ethereum and Solana?
The table and relative-performance section establish which of the three assets performed better over the provider’s daily window. They do not reveal the identity of buyers or the motive behind each trade. The sources consulted here do not isolate a verified Ethereum-specific or Solana-specific catalyst that would explain the whole performance gap.
A more conclusive account would need time-matched evidence such as fund flows, executed trading volume, derivatives positioning or identifiable network developments, together with reliable reporting connecting them to the move. Until those data are verified, the useful conclusion is limited: the prices show the move, the reporting supplies political and institutional context, and the exact weight of each possible driver remains uncertain. This is analysis of available evidence, not a trading signal or a promise about what comes next.
Bitcoin (BTC)
Bitcoin (BTC) is quoted at USD 80482.00, with a daily change of +3.30% over the provider’s comparison window (a gain). The daily percentage describes movement relative to that window’s reference price; it is not a forecast, a guarantee of an executable price, or a return an individual reader has earned.
Ethereum (ETH)
Ethereum (ETH) is quoted at USD 2425.01, with a daily change of +5.90% over the provider’s comparison window (a gain). The daily percentage describes movement relative to that window’s reference price; it is not a forecast, a guarantee of an executable price, or a return an individual reader has earned.
Solana (SOL)
Solana (SOL) is quoted at USD 95.54, with a daily change of +2.20% over the provider’s comparison window (a gain). The daily percentage describes movement relative to that window’s reference price; it is not a forecast, a guarantee of an executable price, or a return an individual reader has earned.
Relative performance within the sample
ETH has the highest daily percentage reading and SOL the lowest. The gap between those readings is 3.70 percentage points. This ranking compares percentages, not asset price levels, trading volume, market capitalization or investment quality. A higher quoted unit price does not by itself imply a larger network or better performance.
Related reporting to follow
The source links below include relevant reporting already published by EconoFlux. They provide separate context; their proximity to this snapshot does not demonstrate that those events caused the observed price moves.
Source, timing and limits
This edition preserves the CryptoNews API price snapshot at 2026-11-04 23:32 UTC. The image is an original visualization of these daily percentage changes, not a historical price chart or a photograph. Quotes may have up to 15 minutes of provider delay and can change after publication. Later editions use new snapshots; this report keeps its original figures and timestamp.
Price data alone do not establish a cause for a move. This edition does not infer ETF flows, liquidations, trading volume, institutional activity or macroeconomic causes from the quotes. Such claims require separate identifiable evidence. This is general market information and does not offer personalized investment advice.
Sources & further reading
- CryptoNews API — archived price snapshot ⟶
- CryptoNews API ⟶
- TokenPost snapshot: $36.33M in crypto liquidations on three exchanges in one hour (reporting, not marketwide) ⟶
- TokenPost: BBVA, Santander prioritise MiCA‑compliant stablecoins for corporate clients; Qivalis participation noted ⟶
- Related report (Spanish): TokenPost: $36.33M en liquidaciones en una hora en tres exchanges (informe, no total de mercado) ⟶
- Related report (Spanish): TokenPost: BBVA, Santander priorizan stablecoins compatibles con MiCA para clientes corporativos; participación en Qivalis reportada ⟶
- CryptoBriefing — Vivian Nguyen, 4 November 2026 ⟶
- BeInCrypto — Kamina Bashir, 4 November 2026 ⟶
- Reuters / Investing.com — Dawn Kopecki, 27 October 2026 ⟶
For information only. Not financial advice.